Plotter
The Plotter class provides a collection of methods to visualize dataset analysis and model evaluations.
Initialize Plotter
To initialize the Plotter, one needs to provide a Dataset and/or a DataModule and/or a Model, depending on the use.
from aixd.visualisation.plotter import Plotter
plotter = Plotter(dataset = dataset)
plotter = Plotter(datamodule = datamodule)
To also use the Plotter for model evaluation, you also need to provide the model object.
plotter = Plotter(dataset=dataset, model=cae)
Most of the following plotting methods ask the user to specify the name of the data block (block) from which to draw the dataobjects to plot.
Some methods allow also to limit the plot to selected data objects within that block(s) by providing their names to the attributes argument.
Caution
The name of the data block must match the blocks used in the dataset or the DataModule!
Default names of data blocks used in the
Datasetare ‘design_parameters’ and ‘performance_attributes’, unless the user named them differently.Default names of data blocks used in the
DataModuleare ‘inputML’ and ‘outputML’, unless the user named them differently.
Hint
When instantiating the Plotter, you get a hint on the attributes and blocks that can be submitted as arguments.
Hint
You can check the names of the data blocks and the data objects defined in a Dataset and the DataModule with:
#Block names:
dataset.design_par.name
dataset.perf_attributes.name
datamodule.input_ml_dblock.name
datamodule.output_ml_dblock.name


# Names of data objects in the block:
dataset.design_par.names_list
dataset.perf_attributes.names_list
datamodule.input_ml_dblock.names_list
datamodule.output_ml_dblock.names_list
Plotter output
One can choose the output format for the plots. Popular formats are show (in a notebook), or a png - the latter will write a png image to disc and requires that the target directory is specified. Setting output to None will return a plotly figure object. This is useful if you want to re-format the plot before saving it, for which you can use write_image() method.
For more detailed specification, see API documentation.
Data exploration plotting functions
The following methods require that the Plotter is initialized with a Dataset or a DataModule.
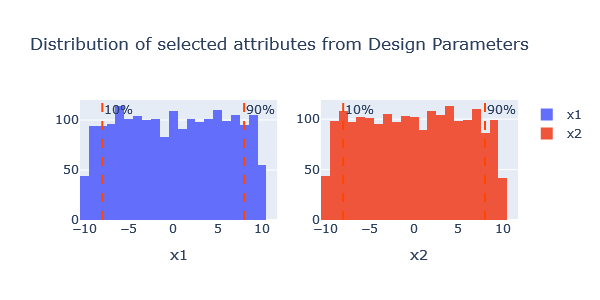
1D Distributions
This function plots the distribution of all selected attributes.
plotter.distrib_attributes(block='design_par', per_column=True, sub_figs=True)
Contour Plots
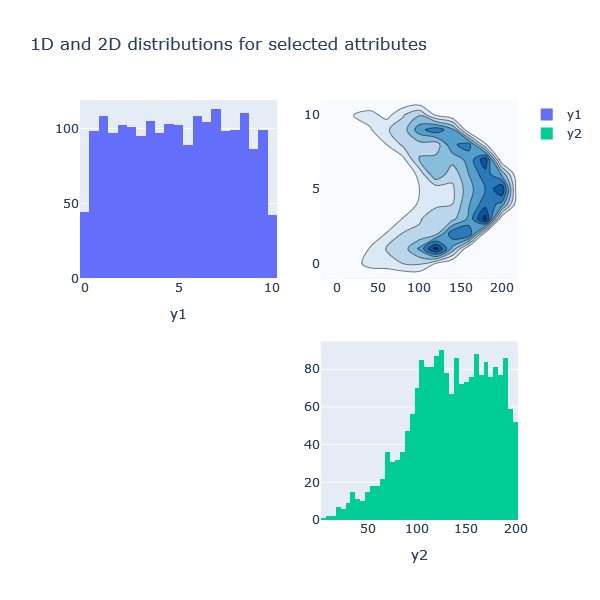
This function plots the 1D distributions and 2D contour plots of the selected attributes.
plotter.contours2d(block='perf_att')
2D Attribute Distributions
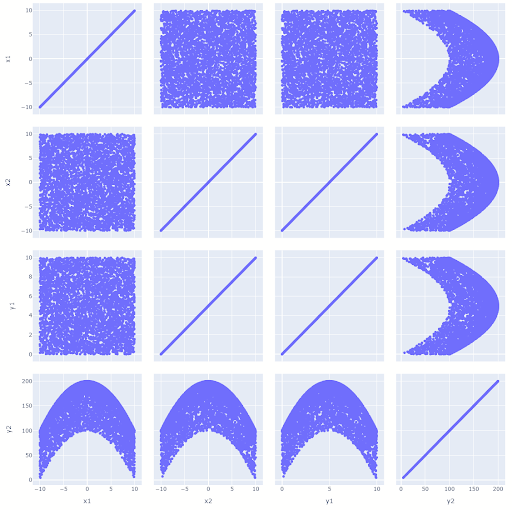
This function plots a joint distribution matrix, of each pair of the selected attributes.
plotter.distrib_attributes2d(block=['design_par','perf_att'])
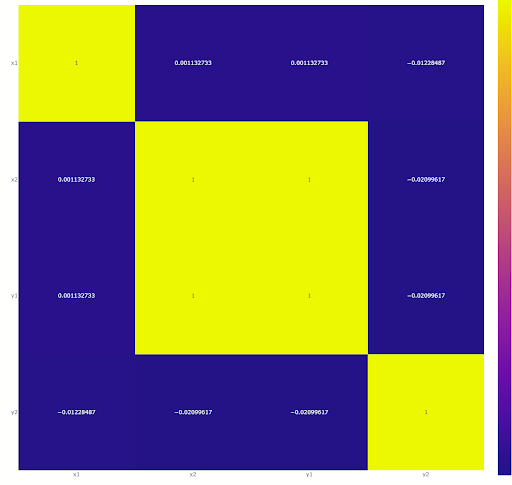
Correlation matrix
This function plots the correlation between all the selected attributes in a matrix. Only numerical attributes are considered.
plotter.correlation(block=['design_par','perf_att'])
Model evaluation plotting functions
The Plotter includes helpful functionalities for the visual evaluation of the performance of your trained machine learning models. These functions allow for a straightforward assessment of how well the Model performs post-training. For detailed guidance on using these plots and interpreting their results, please refer to the model evaluation section of this documentation.
The following methods require that the Plotter is initialized with a Dataset and a Model.
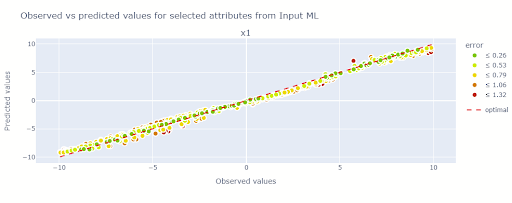
Predicted vs. true value plot
One method to evaluate the trained ML model ist to compare the model predictions with the true observations. For all continuous variables this is visually archived with a scatter plot, where a perfect fit would mean all observations lie on the 45 degree line.
plotter.attributes_obs_vs_pred(block="inputML", attributes=["x1"], datamodule=datamodule)
Evaluate training plot
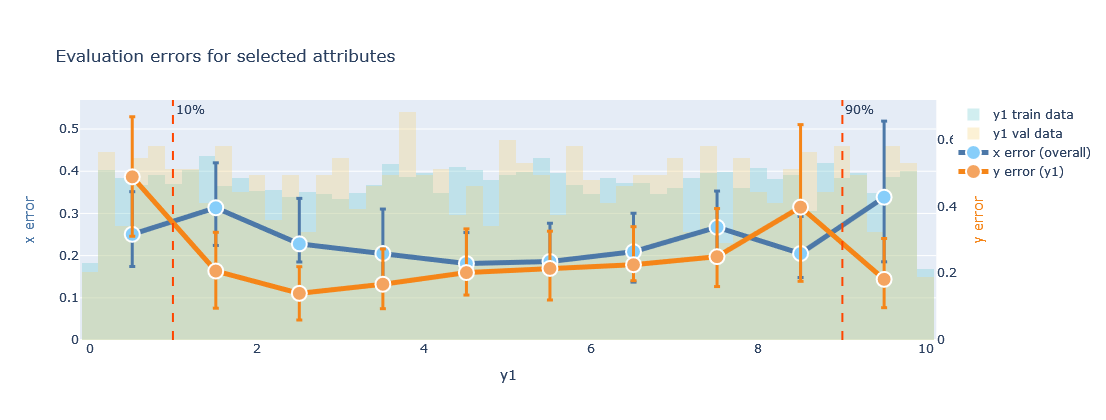
plotter.evaluate_training(datamodule=datamodule, attributes=['y1'],bottom_top=(0.1, 0.9))
Evaluate generation plot
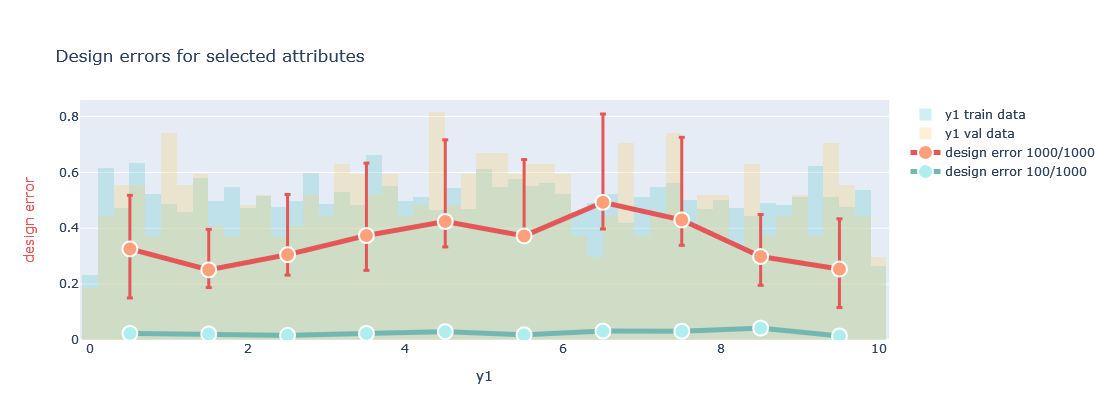
plotter.evaluate_generation(datamodule=datamodule, attributes=['y1'])
